
Calculation of Customer and Laboratory Risks Using Excel
If customer and supplier risks are to be determined dynamically for each test, reports should no longer be prepared in Word. This software is not suited to this type of calculation, and performing the calculations separately from the report can be time-consuming.
For in-house software, sufficient development time must be allocated to implement and validate the calculations. This can readily be done using WINDEV, although not all software packages can accommodate numerical calculations.
Note: Some formulas are only available in Excel 2010 or later. Therefore, if you intend to use Excel, you may need to upgrade your software. Alternatively, fixed multiplying factors may be used if the number of data points is always the same.
Let us return to our pH measurement example:
| 10,2 |
9,7 |
10,3 |
10,1 |
9,8 |
10,5 |
10,0 |
9,6 |
10,4 |
9,5 |
The mean is y
The Type A standard uncertainty is um=±0.11. It can be calculated automatically using:=0.348/SQRT(10)
The significance level is α=0.05, corresponding to a 95% confidence level; the standard deviation is 0.348, and the number of values is n=10 : =CONFIDENCE.NORM(0.05,0.348,10)=0.22
This value corresponds to the Type A standard uncertainty multiplied by a coverage factor of approximately k=2.
Alternatively, because the population standard deviation is estimated from only ten values, Student’s t-distribution could be used: =CONFIDENCE.T(0.05,0.348,10)=0.25
This value corresponds to the Type A standard uncertainty multiplied by
a Student’s t factor of 2.262.
WARNING: This function is only available in Excel 2010 and later versions.
The acceptance limits are reduced using an arbitrarily selected guard band equal to half the Type A standard uncertainty: ≈0.06
Therefore: [TRL=9.56; TRS=10.44]
The customer’s tolerance interval is: [TL=9.5; TS=10.5]
The width of the reduced interval is: w=10.44−9.56=0.88=4U
The customer risk is given by the following equation:
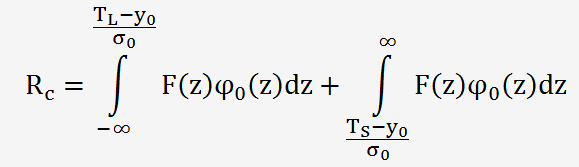
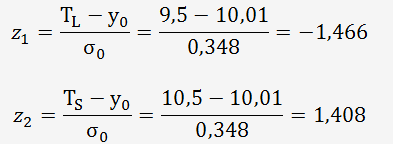
Using the following limits Z
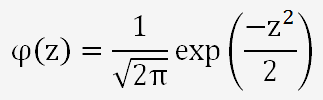
The function φ
F(z) is a probability function expressed as follows:


In Excel format, the equation becomes:
F(z)φ
The variable z covers the following intervals -∞ et -1,466 et 1,408 et +∞.
Because Excel does not directly calculate definite integrals, Simpson’s rule will be used. This method consists of dividing the integration interval into subintervals. The increment depends on the integration limits and the selected number of subdivisions. Numerical simulations show that approximately 20 subdivisions are sufficient to obtain a consistent result.
Pour la première intégrale, nous allons intégrer entre [a=-5;b=-1,466] avec 20 réitérations.
For the first integral, the integration interval is:

Calculate the function values over the interval [a=−5; b=−1.466] at each increment:
with a
b
c
The value of the integral is obtained using the following equation:

Table of Results (Intentionally Rounded)
| n |
a |
b |
c |
F(a) |
F(b) |
F(c) |
[F(a)+4F(c)+F(b)].Δx/6 |
| 1 | -5 | -4,823 | -4,911 | 0 | 0 | 0 | 0 |
| 2 | -4,823 | -4,646 | -4,735 | 0 | 0 | 0 | 0 |
| 3 | -4,646 | -4,469 | -4,558 | 0 | 0 | 0 | 0 |
| 4 | -4,469 | -4,293 | -4,381 | 0 | 0 | 0 | 0 |
| 5 | -4,293 | -4,116 | -4,204 | 0 | 0 | 0 | 0 |
| 6 | -4,116 | -3,939 | -4,028 | 0 | 0 | 0 | 0 |
| 7 | -3,939 | -3,763 | -3,851 | 0 | 1,37E-18 | 1,06E-19 | 5,31E-20 |
| 8 | -3,763 | -3,586 | -3,675 | 0 | 1,86E-16 | 1,67E-17 | 7,50E-18 |
| 9 | -3,586 | -3,409 | -3,498 | 0 | 1,79E-14 | 1,90E-15 | 7,57E-16 |
| 10 | -3,409 | -3,233 | -3,321 | 0 | 1,23E-12 | 1,54E-13 | 5,49E-14 |
| 11 | -3,233 | -3,056 | -3,144 | 0 | 6,02E-11 | 8,97E-12 | 2,87E-12 |
| 12 | -3,056 | -2,879 | -2,968 | 0 | 2,11E-09 | 3,72E-10 | 1,08E-10 |
| 13 | -2,879 | -2,703 | -2,791 | 0 | 5,31E-08 | 1,10E-08 | 2,92E-09 |
| 14 | -2,703 | -2,526 | -2,614 | 0,0000001 | 9,59E-07 | 2,35E-07 | 5,75E-08 |
| 15 | -2,526 | -2,349 | -2,438 | 0,0000010 | 1,25E-05 | 3,60E-06 | 8,20E-07 |
| 16 | -2,349 | -2,173 | -2,261 | 0,0000125 | 0,000117394 | 3,98E-05 | 8,51E-06 |
| 17 | -2,173 | -1,996 | -2,084 | 0,0001174 | 0,000803384 | 0,000319436 | 6,47E-05 |
| 18 | -1,996 | -1,819 | -1,908 | 0,0008034 | 0,004030261 | 0,001869487 | 0,000362561 |
| 19 | -1,819 | -1,642 | -1,731 | 0,0040303 | 0,014989417 | 0,008061568 | 0,001509719 |
| 20 | -1,642 | -1,466 | -1,554 | 0,0149894 | 0,0149894 | 0,025965736 | 0,004737452 |
| TOTAL (Sum of the Last Column)=INT(1) | 0,0066839 | ||||||
For the second integral, the integration interval is: [a=1.408;
b=5] using 20 subdivisions.
The increment is determined as follows:

Calculate the function values over the interval [a=1.408; b=5] at each increment:
Table of Results (Intentionally Rounded)
| n |
a |
b |
c |
F(a) |
F(b) |
F(c) |
[F(a)+4F(c)+F(b)].Δx/6 |
| 1 | 1,408 | 1,588 | 1,498 | 0,04566871 | 0,01613932 | 0,028112051 | 0,005214227 |
| 2 | 1,588 | 1,767 | 1,678 | 0,01613932 | 0,00426068 | 0,008611619 | 0,00164144 |
| 3 | 1,767 | 1,947 | 1,857 | 0,00426068 | 0,00082539 | 0,0001950892 | 0,00038576 |
| 4 | 1,947 | 2,127 | 2,037 | 0,00082539 | 0,000115971 | 0,000322248 | 6,67E-05 |
| 5 | 2,127 | 2,306 | 2,217 | 0,000115971 | 1,17E-05 | 3,84E-05 | 8,42E-06 |
| 6 | 2,306 | 2,486 | 2,396 | 1,17E-05 | 8,47E-07 | 3,28E-06 | 7,70E-07 |
| 7 | 2,486 | 2,665 | 2,575 | 8,47E-07 | 4,36E-08 | 2,00E-07 | 5,07E-08 |
| 8 | 2,665 | 2,845 | 2,755 | 4,36E-08 | 1,60E-09 | 8,72E-09 | 2,40E-09 |
| 9 | 2,845 | 3,025 | 2,935 | 1,60E-09 | 4,14E-11 | 2,68E-10 | 8,12E-11 |
| 10 | 3,025 | 3,204 | 3,114 | 4,14E-11 | 7,61E-13 | 5,86E-12 | 1,96E-12 |
| 11 | 3,204 | 3,384 | 3,294 | 7,61E-13 | 9,87E-15 | 9,05E-14 | 3,39E-14 |
| 12 | 3,384 | 3,563 | 3,474 | 9,87E-15 | 9,03E-17 | 9,86E-16 | 4,16E-16 |
| 13 | 3,563 | 3,743 | 3,653 | 9,03E-17 | 5,83E-19 | 7,58E-18 | 3,63E-18 |
| 14 | 3,743 | 3,922 | 3,833 | 5,83E-19 | 0 | 0 | 0 |
| 15 | 3,922 | 4,102 | 4,012 | 0 | 0 | 0 | 0 |
| 16 | 4,102 | 4,282 | 4,192 | 0 | 0 | 0 | 0 |
| 17 | 4,282 | 4,461 | 4,371 | 0 | 0 | 0 | 0 |
| 18 | 4,461 | 4,640 | 4,551 | 0 | 0 | 0 | 0 |
| 19 | 4,640 | 4,820 | 4,731 | 0 | 0 | 0 | 0 |
| 20 | 4,820 | 5 | 4,910 | 0 | 0 | 0 | 0 |
| TOTAL (Sum of the Last Column)=INT(2) | 0,0073174 | ||||||
Calculation of Customer Risk:

The risk to the conformity assessment body (CAB), i.e., the laboratory, is expressed by the following equation:
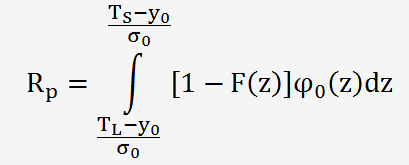
Au format EXCEL, cela devient:
(1-F(z))φ
Calculate the function values over the interval [a=-1,466;b=1,408] at each increment:
The increment is determined as follows:

Table of Results (Intentionally Rounded)
| n |
a |
b |
c |
F(a) |
F(b) |
F(c) |
[F(a)+4F(c)+F(b)].Δx/6 |
| 1 | -1,4661 | -1,3224 | -1,3943 | 0,0941677 | 0,0862200 | 0,0916849 | 0,0131073 |
| 2 | -1,3224 | -1,1786 | -1,2505 | 0,0862200 | 0,0679661 | 0,0780963 | 0,0111775 |
| 3 | -1,1786 | -1,0349 | -1,1068 | 0,0679661 | 0,0452786 | 0,0567091 | 0,0081472 |
| 4 | -1,0349 | -0,8911 | -0,9630 | 0,0452786 | 0,0251355 | 0,0345388 | 0,0049966 |
| 5 | -0,8911 | -0,7474 | -0,8193 | 0,0251355 | 0,0115064 | 0,0174307 | 0,0025481 |
| 6 | -0,7474 | -0,6037 | -0,6755 | 0,0115064 | 0,0043105 | 0,0072242 | 0,0010712 |
| 7 | -0,6037 | -0,4599 | -0,5318 | 0,0043105 | 0,0013140 | 0,0024427 | 0,0003688 |
| 8 | -0,4599 | -0,3162 | -0,3881 | 0,0013140 | 0,0003247 | 0,0006706 | 0,0001035 |
| 9 | -0,3162 | -0,1724 | -0,2443 | 0,0003247 | 0,0000661 | 0,0001494 | 0,0000237 |
| 10 | -0,1724 | -0,0287 | -0,1006 | 0,0000661 | 0,0000208 | 0,0000305 | 0,0000050 |
| 11 | -0,0287 | 0,1149 | 0,0431 | 0,0000208 | 0,0000666 | 0,0000306 | 0,00000050 |
| 12 | 0,1149 | 0,2587 | 0,1868 | 0,0000666 | 0,0003301 | 0,0001512 | 0,00000240 |
| 13 | 0,2587 | 0,4024 | 0,3306 | 0,0003301 | 0,0013470 | 0,0006846 | 0,0001058 |
| 14 | 0,4024 | 0,5462 | 0,4743 | 0,0013470 | 0,0044553 | 0,0025144 | 0,0003800 |
| 15 | 0,5462 | 0,6899 | 0,6180 | 0,0044553 | 0,0119919 | 0,0074979 | 0,0011125 |
| 16 | 0,6899 | 0,8337 | 0,7618 | 0,0119919 | 0,0264133 | 0,0182412 | 0,0026681 |
| 17 | 0,8337 | 0,9774 | 0,9055 | 0,0264133 | 0,0479753 | 0,0364449 | 0,0052745 |
| 18 | 0,9774 | 1,1212 | 1,0493 | 0,0479753 | 0,0726116 | 0,0603354 | 0,0086706 |
| 19 | 1,1212 | 1,2651 | 1,1930 | 0,0726116 | 0,0928776 | 0,0837797 | 0,0119929 |
| 20 | 1,2651 | 1,4086 | 1,3368 | 0,0928776 | 0,1022808 | 0,0991734 | 0,0141788 |
| TOTAL (Sum of the Last Column)=INT(3) | 0,0860 | ||||||
Calculation of Laboratory Risk:

Results with a Guard Band Equal to 50% of the Standard Uncertainty
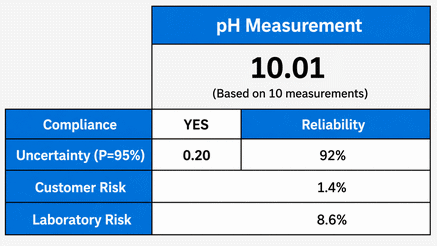
Results with a Guard Band Equal to 100% of the Standard Uncertainty
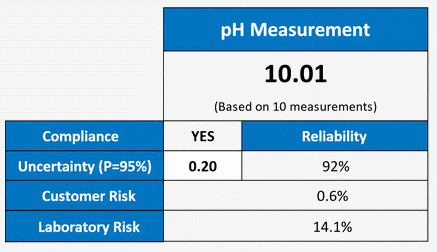
Results with a Guard Band Equal to 100% of the Expanded Uncertainty (ISO 14253-1)

Results with a Guard Band Equal to 100% of the Expanded Uncertainty (Assumed Non-Normal Distribution and ISO 14253-1)

Integration could also be performed using a Student’s t-distribution function involving the gamma function. The calculations then become more complex, and Excel 2016 or later is required because, in earlier versions, the GAMMA function does not support negative input values. Consequently, numerous conditional statements are required depending on the sign of the function result.