Control Charts
The development and implementation of control charts to monitor the potential drift of test results by comparison with reference values obtained from certified standards, production-related results, or traceable reference materials has become a common practice in laboratories.
What is much less common, however, is the procedure associated with these control charts, which defines how the results are to be handled and what actions will be taken if the drift becomes too significant.
The control chart is one of the basic tools used for statistical process control.
It is a graphical representation consisting of a series of test results collected at a defined “sampling frequency,” based on tests performed on samples.
The various calculations performed on the samples, such as the mean, standard deviation, range, count, percentage, and others, are plotted on one or more charts.
It makes it possible to visualize the variability of the test or production process by distinguishing random causes from assignable causes.
A distinction is made between attribute control charts.
Attributes are data based on only two possible values: conforming/nonconforming, success/failure, pass/fail.
The technique of attribute control charts, using the same type of limit calculations as variable control charts, is useful because it makes it possible to monitor progress achieved during production.
However, attribute control charts do not provide a warning of a change in the process before a significant number of nonconformities has been produced.
In addition, in order to obtain a meaningful picture of production, large sample sizes are required.
A distinction must be made between nonconforming products, which either fail to meet technical specifications or have defects so serious that they are rejected, and nonconformities that are defects such as appearance issues or scratches. These defects do not automatically lead to rejection, but they are counted in order to provide a measure of production quality.
Control Charts for Measurement Data
Shewhart control charts for measurement data apply to continuous values such as hardness, force, weight, and similar quantities.
They are highly useful, especially compared with attribute control charts, because a measured value provides much richer information than a simple pass/fail assessment.
The development of a control chart for measurement data is based on:
the assumption that the distribution of the values follows a known distribution, such as a normal distribution or another appropriate distribution;
the properties of the samples.
The implementation of this type of chart is carried out in two distinct phases:
a preparation phase;
an implementation phase.
The preparation phase is particularly useful when setting up a control chart for a process that includes unknown factors, such as selecting the parameters that have a direct influence on the result, verifying whether the distribution is normal, analyzing machine capability, and so on.
An exception should be noted for physically bounded quantities, which often follow a log-normal distribution. In such cases, the data can be converted to a normal distribution by transforming the variable X into X’ = log(X).
This preparation phase makes it possible to define the upper and lower limits used to monitor the process.
In the case of tests performed in a laboratory, this preparation phase is not necessary. Tests carried out on certified reference standards provide results that must fall within a standardized range, within which the machine is considered satisfactory with respect to the criteria of the applicable standard.
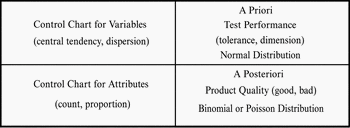
Comparison Table: Variable Control Charts vs. Attribute Control Charts :
Build a control chart using the measurements.
- The following four elements are plotted:
- The recorded or calculated values;
- The mean;
- The lower and upper control limits, normally resulting from a calculation performed using the recorded values. In general, the control limits are determined from the average moving range, Rbar.
For monitoring laboratory tests, these limits are defined by the machine control standards.
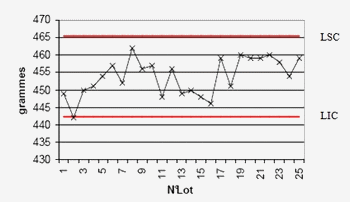
Upper limit (UCL: Upper Control Limit) and lower limit (LCL: Lower Control Limit).
Using Control Charts
The process is stable when the following conditions are met:
- Two-thirds of the points are close to the center line (A and B).
- Few points are located close to the control limits (E and F).
- The points are distributed alternately above and below the center line.
- The points are evenly distributed, with approximately half on each side
of the center line.
- No points fall outside the control limits.
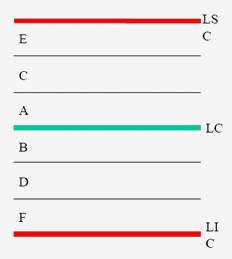
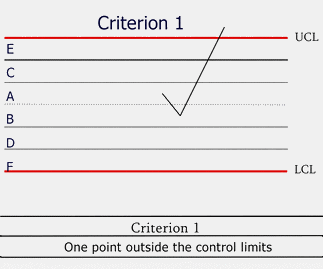
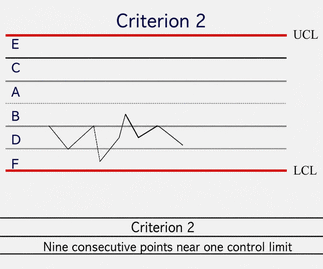
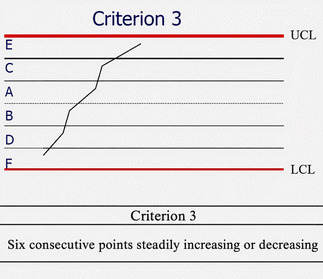
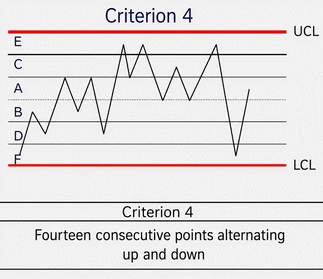
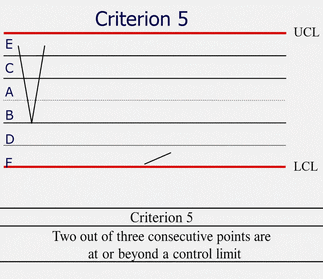
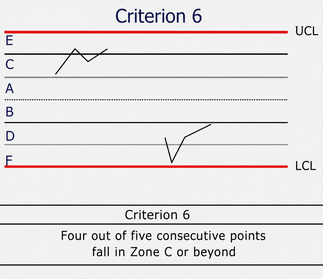
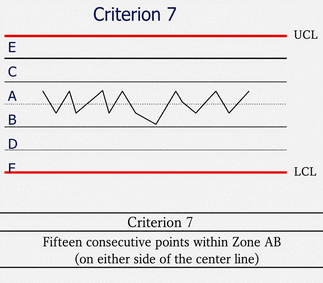
There are 8 criteria for detecting drifts in the monitored process: