Definition of a decision rule:
A documented rule describing how measurement uncertainty will be taken into account when accepting or rejecting an item, considering a specified requirement and a measurement result.
This decision can have significant consequences: the laboratory risks declaring a product conforming when it is not, while the customer risks rejecting a product that is actually conforming.
In all cases, the information reported with the test result and its uncertainty must be related to customer requirements, specifications, and the intended use of the result.
If the risk is high and the conformity decision is borderline, sampling should be expanded, where possible, to reduce risk and refine the mean result, subject to sample availability and the feasibility of repeat testing.
In exceptional cases where particular factors may influence the results but their magnitude cannot be measured or reasonably evaluated, this circumstance should be stated.
Any uncertainty arising from sampling that does not fully represent the product should normally be identified separately in the uncertainty evaluation.
However, when insufficient information is available, a possible statement is: “The test results in this report apply only to the sample tested and not to the product from which the sample was taken.”
Let us review some basic principles that unfortunately show that, even under favorable conditions, our equipment and tests may not provide as much confidence as we would like relative to the tolerance imposed by a specification.

If we consider three identical measured results, each with its own uncertainty at a 95% coverage probability, result A, with expanded uncertainty U, extends beyond the upper limit and may be nonconforming, whereas measurements B and C can be regarded as conforming.
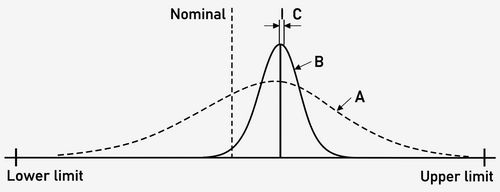
Assume that laboratory C has expanded uncertainty U, laboratory B has U = 2U, laboratory A has U = 3U, and the tolerance or maximum permissible error is 4U.
Let us determine the test uncertainty ratio (TUR), defined by the following relationship:

A commonly used simplified rule is 4:1. In these examples, the ratio does not reach 4; uncertainty is too large relative to tolerance, which unfortunately occurs frequently. This method does not quantify risk; it merely indicates the magnitude of measurement uncertainty relative to tolerance.
To decide whether to accept or reject a product on the basis of a result and its uncertainty, the following should be available:
a) A specification stating the permissible upper and/or lower limits for the characteristics (measurands) being evaluated;
b) A decision rule describing how measurement uncertainty will be considered when accepting or rejecting the product based on its specification and a measurement result;
c) A well-documented procedure unambiguously defining acceptance and rejection regions, ideally specifying or applying the minimum acceptable probability that the measurand lies within specification limits.
Instructions should also be provided for handling repeated measurements and outliers whenever possible.
d) Under the decision rule, the size of the acceptance or rejection region may be determined using appropriate guard bands.
The guard band width is calculated from the measurement uncertainty and the minimum acceptable probability that the measurand lies within specification limits.
e) Reports containing statements of conformity should also reference the decision rules used.
During conformity assessment, the measured value is compared against one or two acceptance limits (an upper limit, a lower limit, or a tolerance interval).
If the measured value is within the acceptance region, the product is considered conforming. If it lies outside that region, the product is considered nonconforming and is rejected.
Acceptance limits may be the technical specification limits or more stringent control limits.
Because of measurement uncertainty, the measured result y and the true value x of the observed characteristic differ.
The conformity decision based on y = x + U considers the measured value as the sum of the true value and measurement uncertainty U. Product conformity, however, depends on the relationship between x, the upper specification limit (USL), and the lower specification limit (LSL).
This tolerance can lead to four decision outcomes: correct acceptance, correct rejection, and two types of decision error.

Decision rules present particular difficulties near specification limits.
Because of measurement uncertainty, a product with a measured result just inside a specification limit may in fact be nonconforming, and conversely for a result just outside the specification region.
If nonconforming parts have a major economic impact, it may be preferable to establish two-sided guard bands.
Guard banding can produce a reduced acceptance region (smaller than the specification interval).
Guard band width, g, may be expressed as a percentage of expanded uncertainty; for example, a 100% guard band has a width equal to the expanded uncertainty.
Selecting the guard band width is a decision made by the conformity assessment body (CAB) and the customer, based on economic considerations, whereas evaluating measurement uncertainty U is a technical activity dependent on the measurement process.

In this configuration, the reduced acceptance region is narrower, but confidence increases that a measured result falling within it corresponds to a product that meets the specifications.
Here, the probability of the CAB obtaining conforming results decreases, while the likelihood that the customer receives acceptable parts increases (at the risk of rejection of an entire lot).

The reverse arrangement can also be applied: the acceptance region is widened by considering two-sided guard bands when declaring conformity.
In this second configuration, the probability of the CAB obtaining conforming results increases, but the customer has less assurance that every part is acceptable.
Guard band width g depends on the uncertainty value and is chosen to meet the requirements of the decision rule.
For example, if the decision rule specifies that a product may be declared nonconforming only when the measured value is above the limit plus U, the guard band width is 2u.
If the rule instead requires at least a 95% probability that the measurand exceeds the lower specification limit (LSL) before declaring nonconformity, g must be selected so that an observed value of LSL + g corresponds to a 95% probability of exceeding the LSL.
Similarly, if the decision rule requires at least a 95% probability that the measurand is below the upper specification limit (USL), g is selected so that, at an observed value of USL + g, that probability is 95%.
In general, g is a function of, or a simple multiple of, u, where u is the standard or combined standard uncertainty.
According to ISO 14253-1, a multiplier of 1.65u provides a 95% probability of conformity.
In some cases, the decision rule specifies the multiplier to be used.
In other cases, the guard band depends on the required probability P and the known distribution of likely measurand values.
In short, a decision rule cannot simply be imposed unilaterally by the CAB. The CAB and customer need to discuss and agree on a rule that is acceptable to both parties.
The type of laboratory will also influence decision-making. An independent laboratory may consistently propose a decision rule that disadvantages the customer (a reduced acceptance region to limit the risk of declaring a nonconforming product conforming), leaving the customer to accept the risk of rejected parts or lots.
Conversely, an in-house laboratory testing the products made by its plant may propose a rule favoring production (an expanded acceptance region to reduce the risk of rejecting its own products), with the customer accepting the risk that some nonconforming parts may be accepted.
According to ISO 14253-1, the risk is always borne by the provider of the result, and therefore by the laboratory. The permissible tolerance should accordingly always be reduced by 1.65u (with a greater risk of declaring a result nonconforming).
What about uncertainty itself? If the guard band is taken as equal to uncertainty, its magnitude relative to the measured parameter becomes critical. Consider two laboratories L and L, using the same test method, with uncertainties X and 3X, respectively. Independent laboratory L exposes its customer to three times the risk-related effect, regardless of the decision approach: under a reduced acceptance region, more parts may be rejected or an entire lot may be deemed nonconforming; under an expanded region, more potentially nonconforming parts may be accepted, possibly causing critical problems in service.
Furthermore, if laboratory uncertainty equals or exceeds half the tolerance specified by the customer, a reduced acceptance region would shrink to zero (no part could be declared conforming). Under the approach described here, only an expanded acceptance region would remain.
Customers have often been criticized for showing little interest in measurement uncertainty. That is likely to change. Explaining these concepts may be difficult when the customer is unfamiliar with them, and obtaining consent to a decision rule that creates a risk for production may be challenging. Customers may also feel misled when the first results, particularly unfavorable ones, are received.
Another concern is that some laboratories may underestimate certain uncertainty components to drastically reduce the expanded uncertainty associated with their results, fearing the loss of customers when perceived risk becomes too high. This would be dangerous for both the customer and the CAB.

Probability P = 95% (k = 2) of obtaining acceptable parts with a reduced acceptance region.

For more information about confidence intervals, see the technical note: Confidence Intervals.
Consider a pH measurement by titration (sodium hydroxide) in a detergent. The customer specifies 10.0 ± 0.5 pH units.
| 10.2 | 9.7 | 10.3 | 10.1 | 9.8 | 10.5 | 10.0 | 9.6 | 10.4 | 9.5 |
The mean of the 10 results is 10.01 mg/L, and the standard deviation σ of the results is 0.348 mg/L.
The confidence interval is calculated using the following equation:
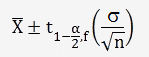
Assuming a significance level α = 0.05 and V = n − 1 = 10 − 1 = 9 degrees of freedom, we obtain t = 2.262.

Using Excel: =CONFIDENCE.T(0.05,0.348,10) = 0.25 (available starting with Excel 2010).
Because the customer’s specification interval is [9.5, 10.5], the sample analysis is conforming to the specification.
The probable proportion of nonconforming analyses can also be determined; see the technical note: Statistical Controls.

Although the results fall within the customer’s tolerance, the estimated proportion of nonconforming values remains 15%, compared with 85% conforming values.
This is additional information for the customer that should be included in the report.
The conformity decision is reported together with the probability of making a correct decision, for example: “Conforming (the reliability of the decision is estimated at 85%).”
Not all laboratory tests can be performed repeatedly, particularly when the tests are destructive.
In this case, the guard band width will be ku. The value of k (or t, if a non-normal distribution can be demonstrated) will either be specified in the decision rule or derived from the probability distribution of the values assigned to the measurand, which is usually assumed to be normal.
In many cases, current practice is to use k = 2.
Assuming an approximately normal distribution, this provides a confidence level of about 95%, corresponding to the interval x ± 2u for an observed value x.
On this basis, the probability that the measurand value is less than x + 2u is approximately 95%.
In the common case where conformity to an upper limit must be demonstrated, taking k = 2 and requiring unambiguous evidence of nonconformity is equivalent to setting a guard band g = +2u.
Consider a tensile test yielding an ultimate tensile strength of 753 MPa, with the customer’s material specification set at 745 ± 15 MPa (730–760 MPa).
Since repeated tests are not available to calculate a standard deviation, we use the expanded measurement uncertainty associated with the result, U = ±7 MPa.
This expanded uncertainty is determined for a coverage probability of 95% (k = 2).
The confidence interval is given by the following relationship:

With respect to the customer’s specification, the measured value is conforming.
Because only one result is available, we cannot establish whether the measurements follow a normal distribution or whether our result is biased. We therefore seek to reduce the bias by subtracting the deviation measured between our load cell and the reference load cell used during calibration at the relevant force. The certificate indicates that the load cell is class 0.5 and has a negative bias of 0.2%; according to the approach described here, this is added to the uncertainty, i.e., +1.5 MPa.
Adding bias to uncertainty remains acceptable, according to the approach described here, as long as the ratio of bias to standard or combined standard uncertainty is less than 2. See Bias and Measurement Uncertainty.
Note that this is the bias at a particular point in time. It would be systematic if the force transducer displayed the same deviation year after year; in that case, the uncertainty should already account for it.
We will determine the standardized variable z using the known uncertainty and the following equation:

Note that the combined standard uncertainty is used, not the expanded uncertainty.
The corresponding probabilities can then be determined:

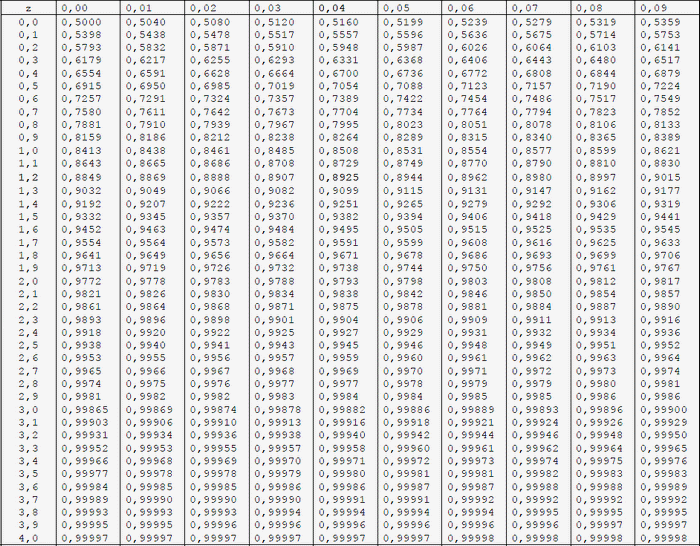
The standard normal table gives 0.9192 for z = 1.4 and approximately 1 for z = 4.6. Consequently, the probability that the tensile strength is conforming is 91.9%, and the probability that it is nonconforming is 8.1%.
The conformity decision is stated in the report together with the probability of a correct decision, for example: “Conforming (decision reliability is estimated at 91.9%).”
Without bias, decision reliability is 97.7%.
With positive bias, decision reliability is 99.9%.
If the specification includes only a single lower limit, the probability can still be estimated using that one limit.
This demonstrates the importance of correcting bias at the time of measurement and using a measurement uncertainty representative of both the test method and the sample. Systematically increasing all uncertainty components may quickly lead to a decision reliability of less than 70%.
A spreadsheet containing the specification and results can automatically determine decision reliability and conformity.